


How does the Oscilloscope's X-Y Display Work ?
Overlaying one trace over another is feasible through the use of an X-Y display, sometimes termed a scatter plot or cross plot. This type of plot allows the comparison of two waveforms, illustrating their interrelation. This two-dimensional graphic can be adapted to incorporate a third parameter, such as recurrence frequency, represented through variations in color or intensity.
X-Y display modes find various applications, ranging from traditional Lissajous diagrams used for calculating phase or frequency ratios to modern state transition diagrams employed in quadrature communication systems. Whenever there is a connection between two variables, it can be illustrated with an X-Y plot. Additionally, the plot can reveal whether the relationship is linear or nonlinear, as well as its direction. This article will delve into some of these applications.
I. Lissajous
In a Lissajous , two sine waves are graphically represented against each other—an application commonly associated with an X-Y display. This graphical representation aids in determining the phase difference between sine waves of identical frequencies. The utilization of a modern oscilloscope simplifies the process of obtaining the phase difference, as only one measurement parameter needs to be examined. Figure 1 provides an illustration of how to calculate the frequency ratio of sine waves with differing frequencies. Figure 1 displays an X-Y plot of two harmonically related sine waves, showcasing the ratio of the number of horizontal peaks to the number of vertical peaks, representing a 2-to-5 input signal frequency ratio.
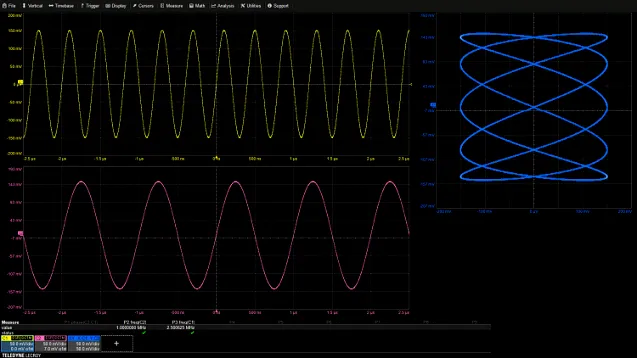
The graph indicates that the relationship between the frequencies of the two input signals is 2 to 5, with actual measured frequencies of 1MHz and 2.5MHz, respectively.
II. Curve Tracker
The V-I properties of a semiconductor device can be depicted using an X-Y plot, an oscilloscope, and an arbitrary waveform generator (AWG).The measurements for a silicon diode. is the V-I curve derived from 12 voltage values generated by the Arbitrary Waveform Generator (AWG) and the corresponding current flowing through the silicon diode.
By applying 12 pulses to the diode, the voltage amplitude from the AWG sequentially increases from -5V to +5V. Utilizing the oscilloscope's sequence mode, with one pulse per sequence segment, allows the measurement of voltage across the diode and the current flowing through it. Each point on the trend graph represents one parameter value, showcasing the recorded voltage and current parameters. The horizontal input axis on the X-Y display represents voltage scaled at 1 volt per division, while the vertical axis represents current scaled at 12.4 mA per division. The resulting X-Y map effectively illustrates the V-I properties of the diode. This simple test proves valuable for component matching applications.
Ⅲ. Quadrature Signal Measurement
The quadrature signal generating algorithm combines two signals that are 90 degrees out of phase, creating a variable phase signal. The addition of these signals in quadrature defines a vector with magnitude and phase. The strength of the input signal governs two aspects of the vector. The X-Y plot facilitated by the X-Y cursor, enabling the observation and monitoring of the phase and amplitude of vectors generated by quadrature input signals.
The phase trace of a vector is presented as an X-Y plot, showcasing two quadrature signals (the sum of squares of the signals). The X-Y cursors facilitate the reading of Cartesian coordinates, as well as vector magnitude (radius) and phase (angle).
The X-Y display reveals the path of the rotational vector trace, determined by the sum of the squares of two exponentially weighted RF pulses. This trace is observable on the X-Y display, and the X-Y cursors allow the reading of the voltage at the source sample points in channels 1 and 2, along with the vector magnitude (radius) and phase relative to the positive X axis. The cursor readouts are applicable to waveforms X-Y, X-T, and Y-T, indicating simultaneous measurement of all cursor measurement vectors' source components. For instance, the 401mV vector magnitude has an X component of 349.6mV and a Y component of 196.9mV. Identifying the source of error for these vector parameters proves valuable in applications requiring quadrature signal production, such as radar and digital communications.
The X-Y display can also offer a persistence display, maintaining several traces covered in the diagram. Intensity or color is employed to indicate the frequency with which pixels are displayed. Figure 2 illustrates the in-phase (I) and quadrature (Q) components of a 16QAM signal, accompanied by an X-Y state transition diagram depicting how the I component is determined based on the Q component. Monochromatic persistence is utilized in this X-Y display.
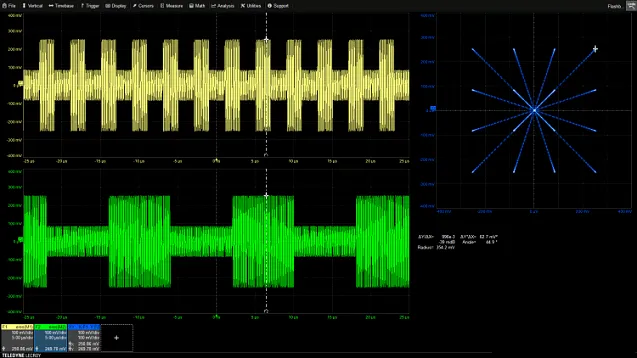
Figure 2: Monochromatic Persistence X-Y Plot
Presented in Figure 2 is an X-Y plot created using monochromatic persistence. Bright spots on the plot represent the data states of the state transition diagram, while the phase paths of multiple transitions appear even brighter.
State transition diagrams delineate paths between data states, displaying the states of the data at each end of the transition path. The data states manifest as brighter dots on the X-Y plot, indicating that the waveform spends more time in each data state than in the transition route. The two distinct vector magnitudes for the four phase states of 45, 135, 225, and 315 degrees are repeated, contributing to their brighter appearance. Consequently, the afterglow plot provides additional insights into this measurement, offering a clearer depiction of overlapping vectors.
Ⅳ. X-Y Measurements Related to Power
The X-Y display proves valuable in measuring power switching devices. Figure 3 illustrates the voltage against current across the power FET (Safe Operating Area - SOA) to ensure the device operates within its safe operating range.
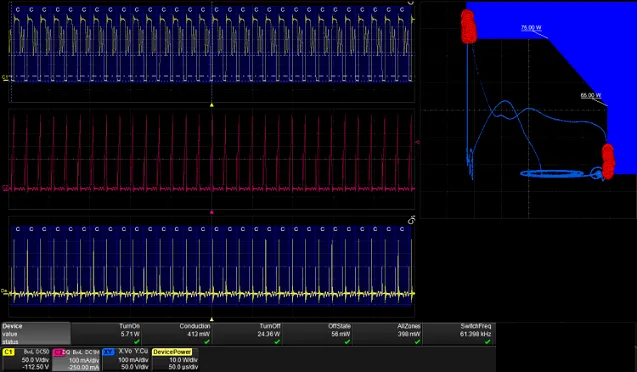
Figure 3 displays an X-Y plot utilized to measure the Safe Operating Area (SOA) of a power Field-Effect Transistor (FET), plotting drain current against drain-source voltage. The Pass/Fail test involves comparing the X-Y plot to the template, with red circles indicating failure.
The vertical axis represents drain current, while the horizontal axis represents the drain-source voltage (VDS) across the FET. When the FET is on, the vertical portion of the X-Y diagram indicates a nearly constant VDS as the current rises. Conversely, when the FET is off, the current is 0, and the voltage fluctuates when the horizontal ring is horizontal, representing the switching transitions during power loss. This test verifies that the device has not exceeded its maximum allowable voltage, current, and power.
A "pass/fail" template for tracking measurement results is presented in the blue section, and the X-Y traces should not intersect with the template.
Another X-Y measurement related to power involves assessing the magnetic properties of inductive devices.
Ⅴ. Mechanical Measurement
In the realm of mechanical analysis, X-Y graphs prove valuable. To convert mechanical data into proportional electrical signals, appropriate sensors are essential. An excellent example of an X-Y diagram for a mechanical unit is the pressure-volume diagram of an engine.
Magnetic Properties Measurement
The hysteresis diagram relies on the inputs of magnetic field intensity and magnetic flux density. The magnetic flux density results from the integral of the applied voltage, while the magnetic field intensity is determined by the current flowing through the inductor. These computations can be performed using the oscilloscope's software option for power measurements, incorporating coil geometry (cross-sectional area and magnetic path length), known voltage, and current. Inside the hysteresis loop, energy loss per cycle, known as hysteresis loss, takes place.
The pressure sensor, affixed to the cylinder spark plug, gauges pressure values, while the rotary encoder utilizes the measured crank angle to determine volume. Both sensors make use of the oscilloscope's rescaling feature, allowing measurements in standard pressure and volume units, such as Pascals and Liters. The resulting Pressure-Volume (PV) diagram exhibits two rings—the upper one representing the exhaust stroke and the larger one below signifying the power stroke. The area enclosed by the PV map's loop correlates with the mechanical work output per engine cycle. Negative work is associated with the exhaust stroke, while positive work characterizes the power stroke.
Ⅵ. Summary
It is evident that the X-Y display proves to be an invaluable tool for interpreting measurements. Beyond merely comparing signals, it visually represents relationships between plotted variables and graphically displays vector magnitude and phase for quadrature inputs. Furthermore, it can unveil energy gains or losses during operation. Engineers exploring dual trace applications for digital oscilloscopes should keep this versatile instrument in mind for its diverse applications and analytical capabilities.


